Your stock dashboard for finding stretched trading setups in seconds
A free trading dashboard that scans your watchlist for overbought and oversold setups across multiple timeframes, then lets you inspect Smart Money context on the chart.
Free to start. No credit card required.
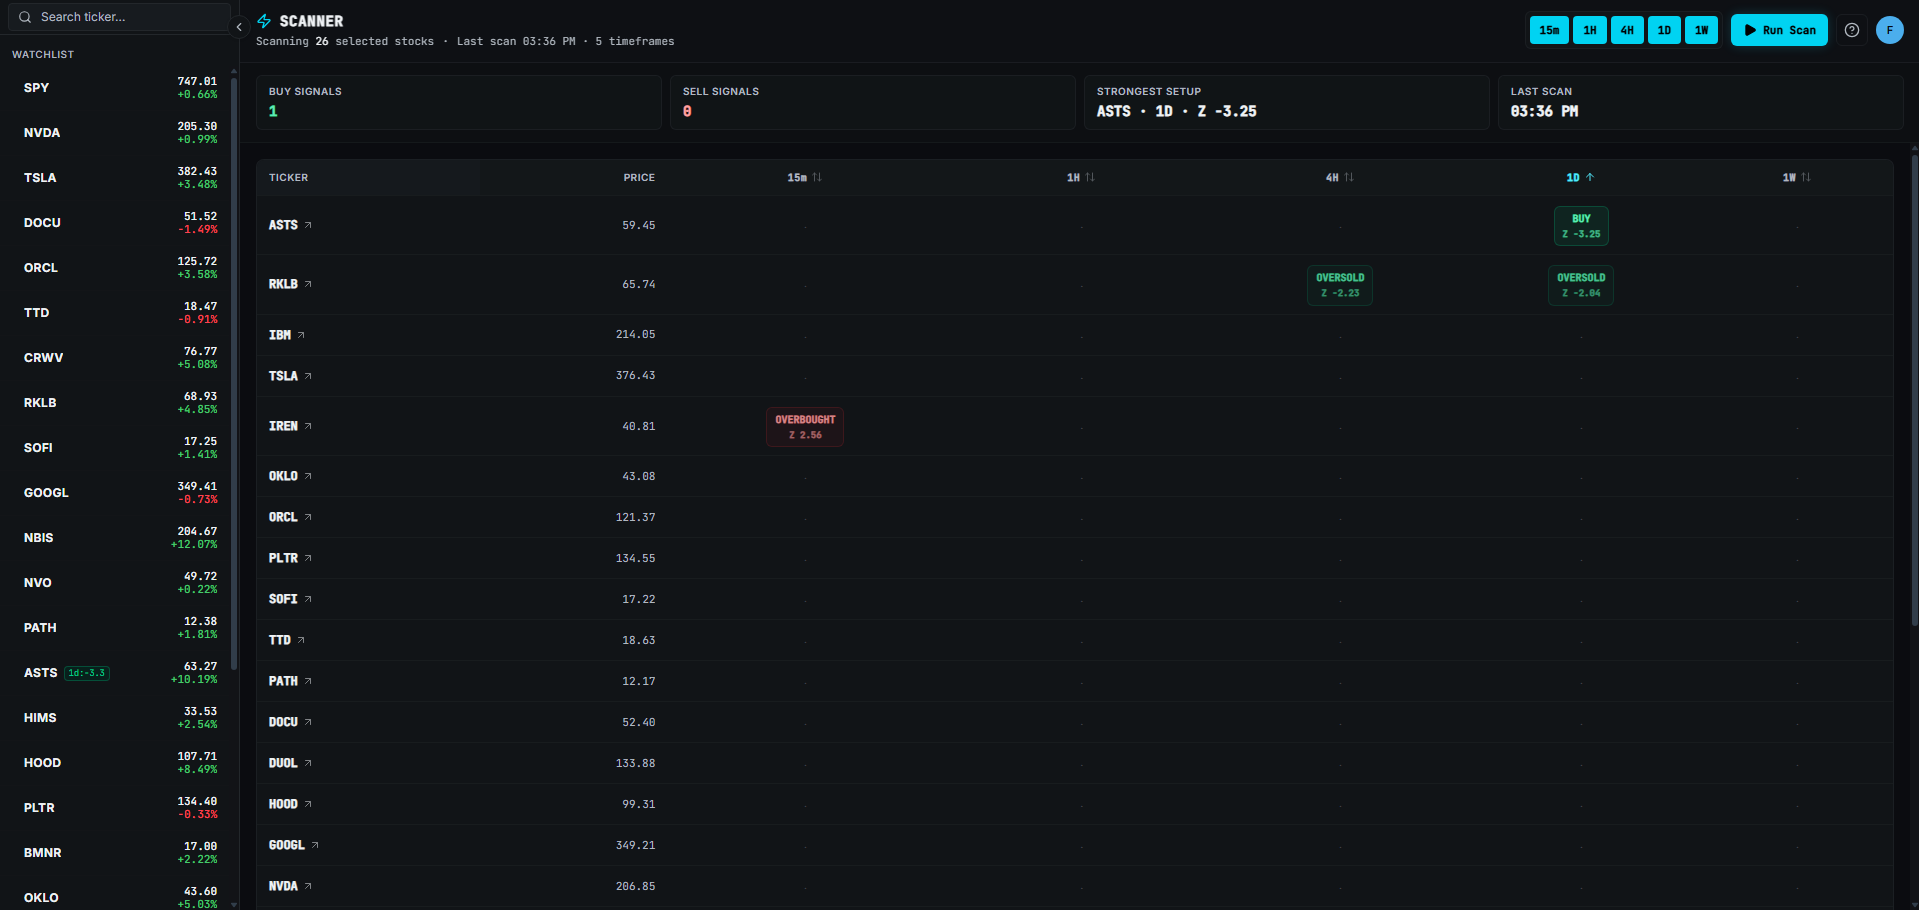
How the Trading Dashboard Works
Choose timeframes
Select the horizons you care about, from short-term momentum to higher timeframe context.
Run the scan
Rank your watchlist by statistical stretch so the most extended names rise to the top.
Open the chart
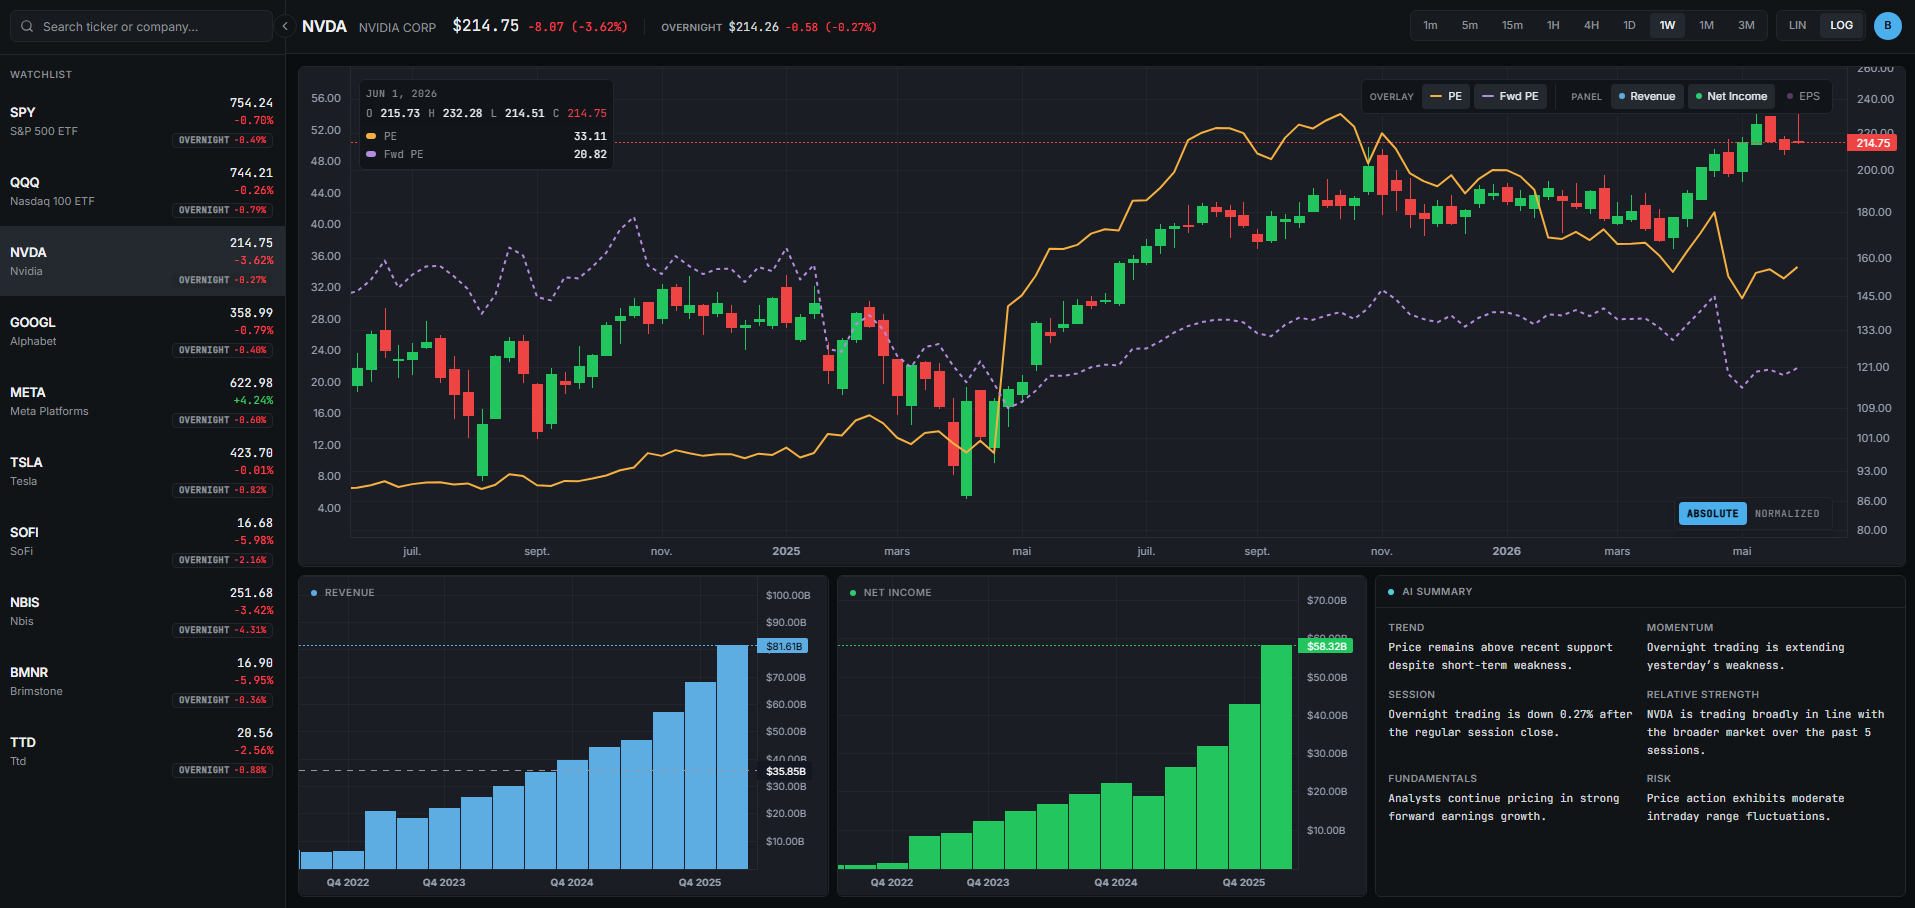
Drill into any result and inspect Smart Money Candles, zones, and key levels before acting.
Why Traders Choose This Stock Dashboard
Scan your own watchlist
Start with the tickers you already follow and find the names that need attention first.
Multi-timeframe signals
Compare stretch across multiple horizons instead of checking each chart one by one.
Find stretched setups faster
Surface overbought and oversold conditions quickly, then decide which setups deserve chart time.
Inspect Smart Money context
Open a result on the chart to review Smart Money Candles, support and resistance, and key levels.
Found from the trading dashboard, then inspected on the chart
The stock dashboard shows the ticker, timeframe, signal direction, and z-score at a glance. From there, open the trading terminal chart to review whether Smart Money context supports the setup.
Open Scanner ExampleReady to open your trading dashboard?
Run a free scan on the stock dashboard, find stretched setups, and open charts only when the setup deserves a closer look.
Run Free Scan